Household WEEE collection by retailers
Following 2020 when consumption focused on household equipment at the expense of other sectors (leisure, travel, etc.), collection levels in retail in 2021 were unprecedented when more than 136,000 tonnes of WEEE were collected.
An exceptional year
2021 was characterised by an increase of large household items that has not been seen for 35 years and which constitute the main source of tonnages collected in the retailing sector. The sales for this category rose by 10.8% between 2020 and 2021, mainly due to households who spent a large part of their budget on improving the quality of their homes. In regards to small household equipment these rose by 2.9%.
ecosystem had to adjust its logistics in order to both meet the needs caused by these exceptional increases and boost its presence amongst its partners.
The high level of activity that was observed also initiated the launch of the repair and redeployment-reuse fund introduced by the French AGEC Law (Anti-waste and Circular Economy, passed in February 2020). Key levers for prolonging the service life of appliances, these mechanisms incite consumers to have their broken down equipment repaired thanks to the payment of a financial contribution which reduces repair costs. These will also facilitate access to quality sources by Social and Solidarity Economy stakeholders in view of reusing appliances.
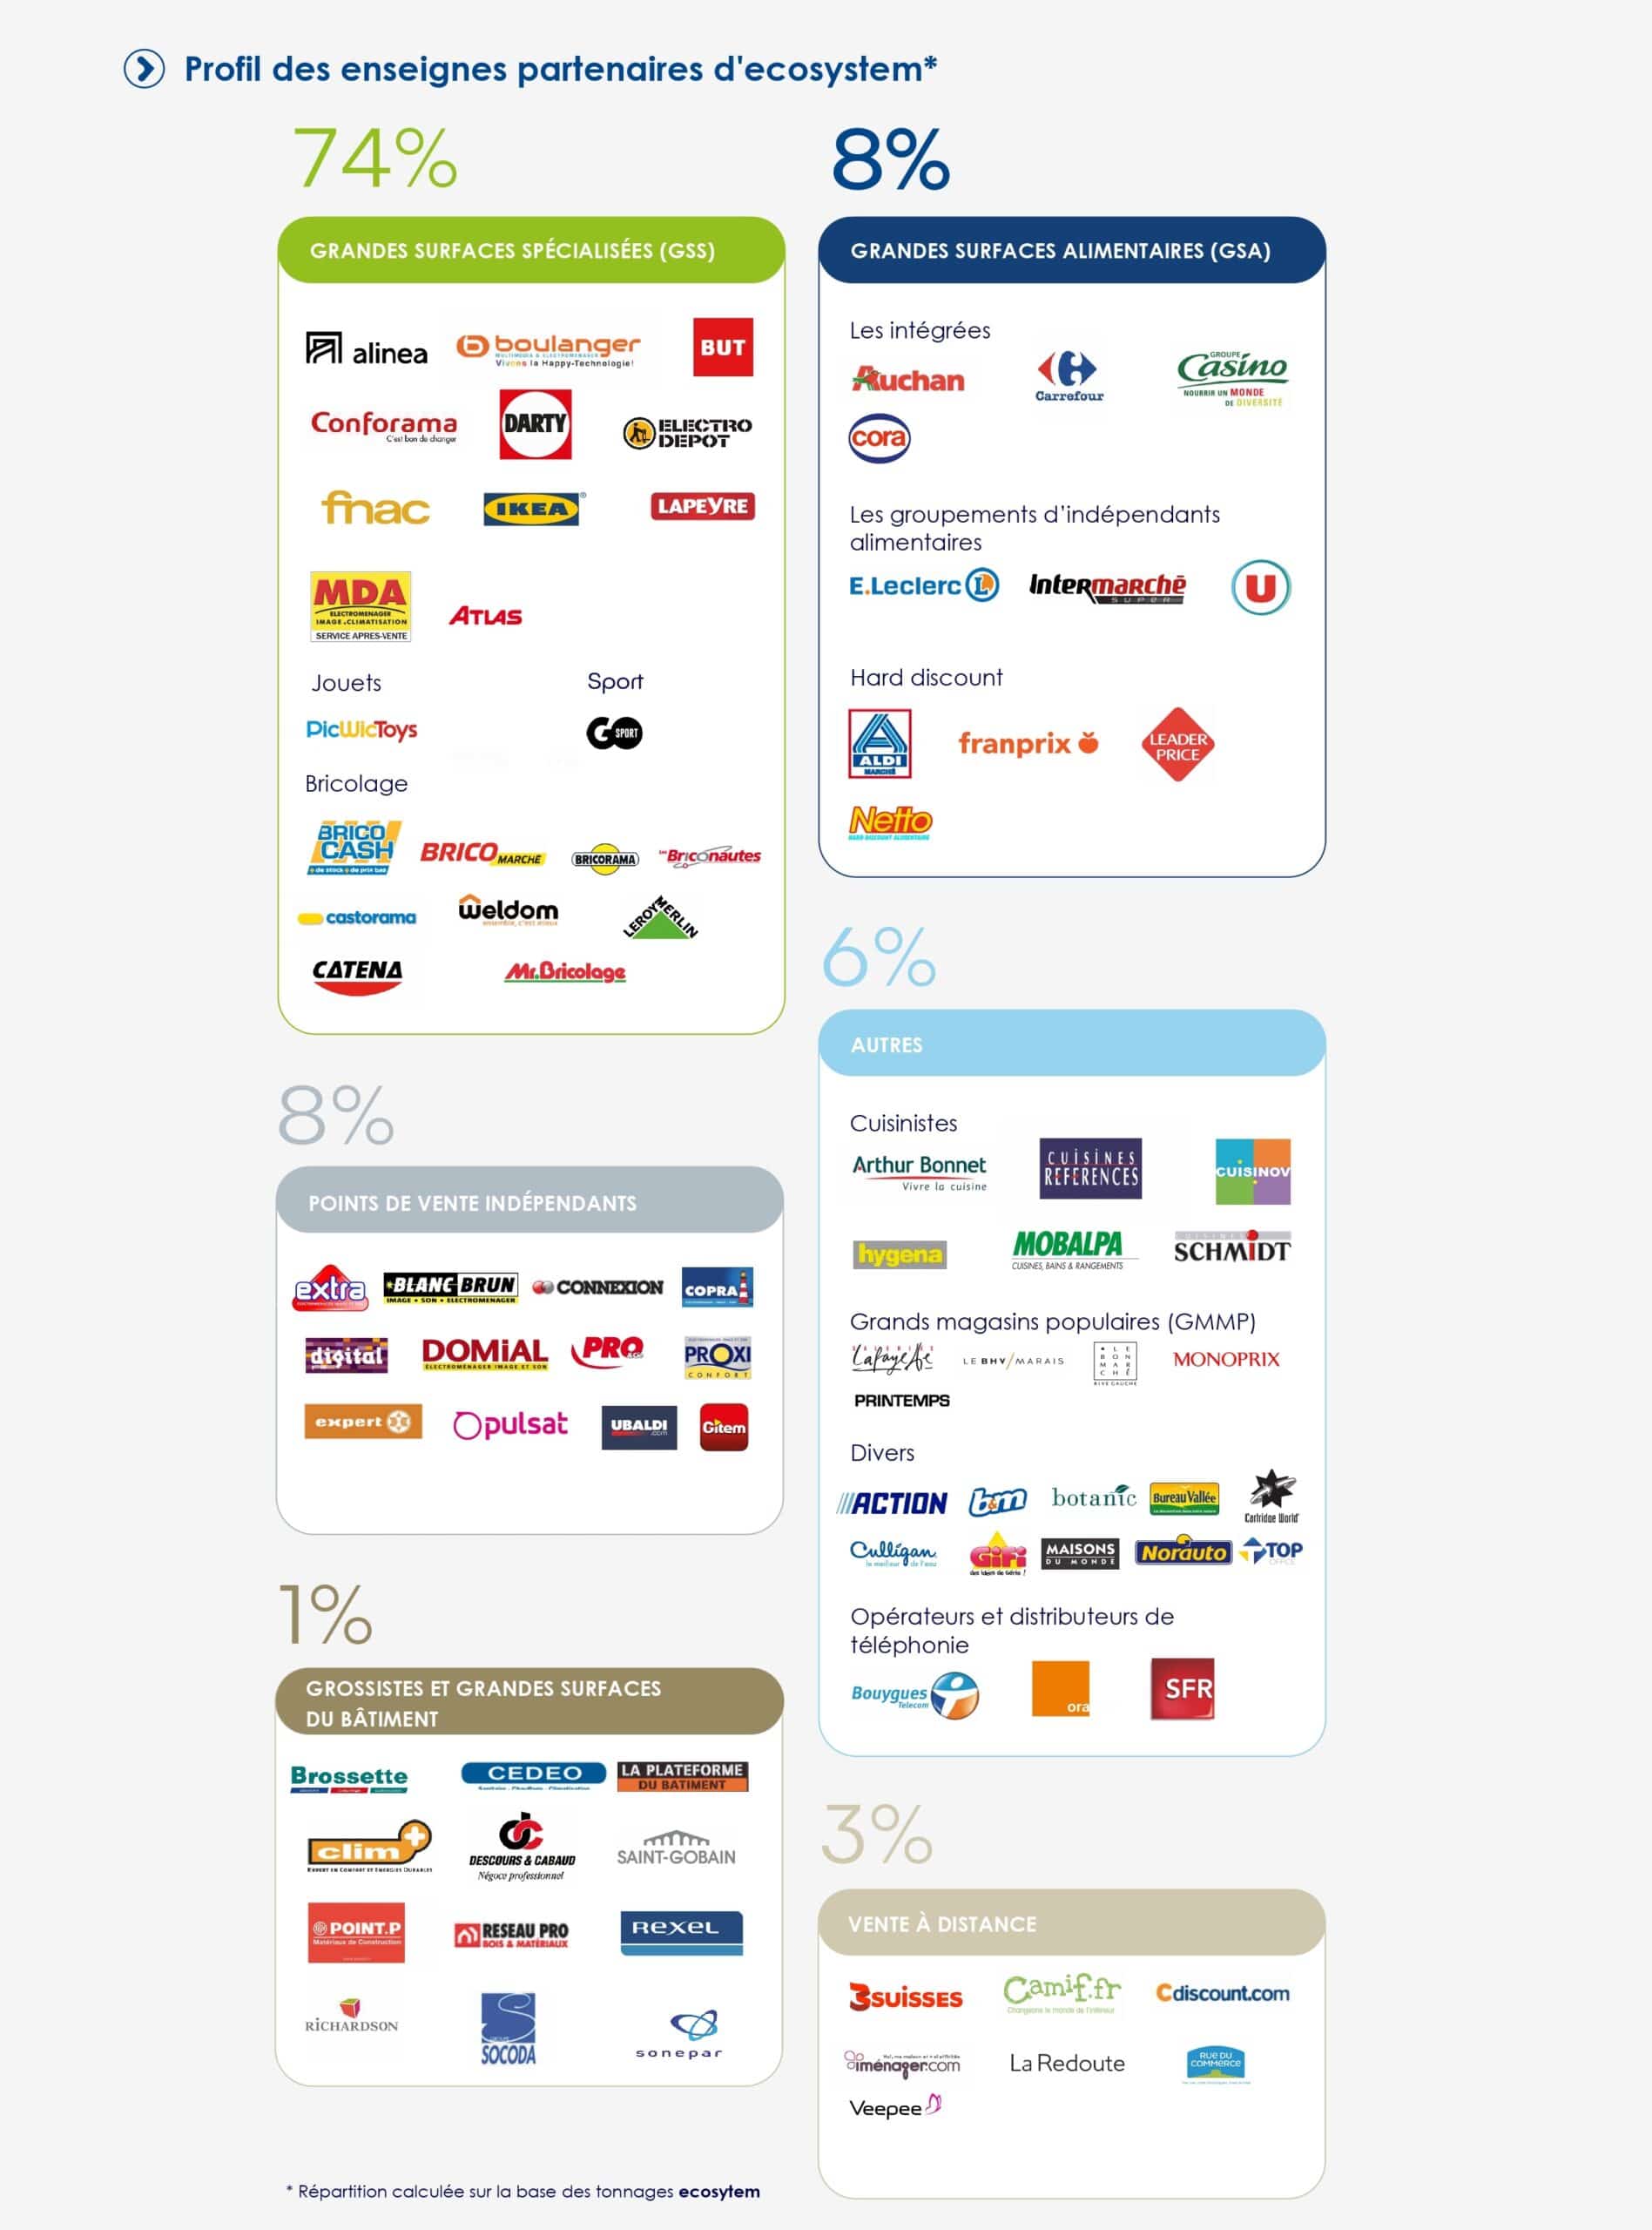
Profile of store brand partners
*This breakdown has been calculated using ecosystem tonnages.
Cliquez sur + pour découvrir l'infographie.
Quantity collected per stream
Retailers collected 136,174 tonnes of household WEEE.
Click on + to see the breakdown of collection per stream.
Number of collection points and amounts collected per type of retailer
| RETAILERS | TONNAGES | OPERATIONAL COLLECTION POINTS |
|
Large food stores
|
10 946,1 | 1 803 |
| Specialised supermarkets
|
100 905,2 | 1 759 |
| Independents (under a store name)
|
10 674,2 | 641 |
| Building industry wholesalers and shops
|
1267,3 | 199 |
| Mail/internet order
|
4 416,1 | 52 |
| Other independents (building trade, kitchen designers/fitters, mobile telephone, etc.)
|
7 965,5 | 1 257 |
Density of operational recycling facilities
Click on + to see the map showing the number of recycling facilities per county.


